The most valuable metric in a sales dashboard
Most sales dashboards feature metrics like this:
- Deals Sold
- Average Purchase Value
- New Monthly Recurring Revenue (MRR)
- Quote To Close Ratio
- Number of Contacts Made
These metrics tend to focus on either the top of the sales funnel (contacts made) or the bottom of the funnel (deals sold). But looking exclusively at the top and bottom of the funnel can be unhelpful or even misleading. Good performance at the top of the funnel can be an indicator of great lead generation but doesn’t say anything about follow up efforts. And while the bottom of the funnel is where the rubber meets the road it isn’t always actionable in the short term — particularly when selling a low volume product.
What is Pipeline Activity
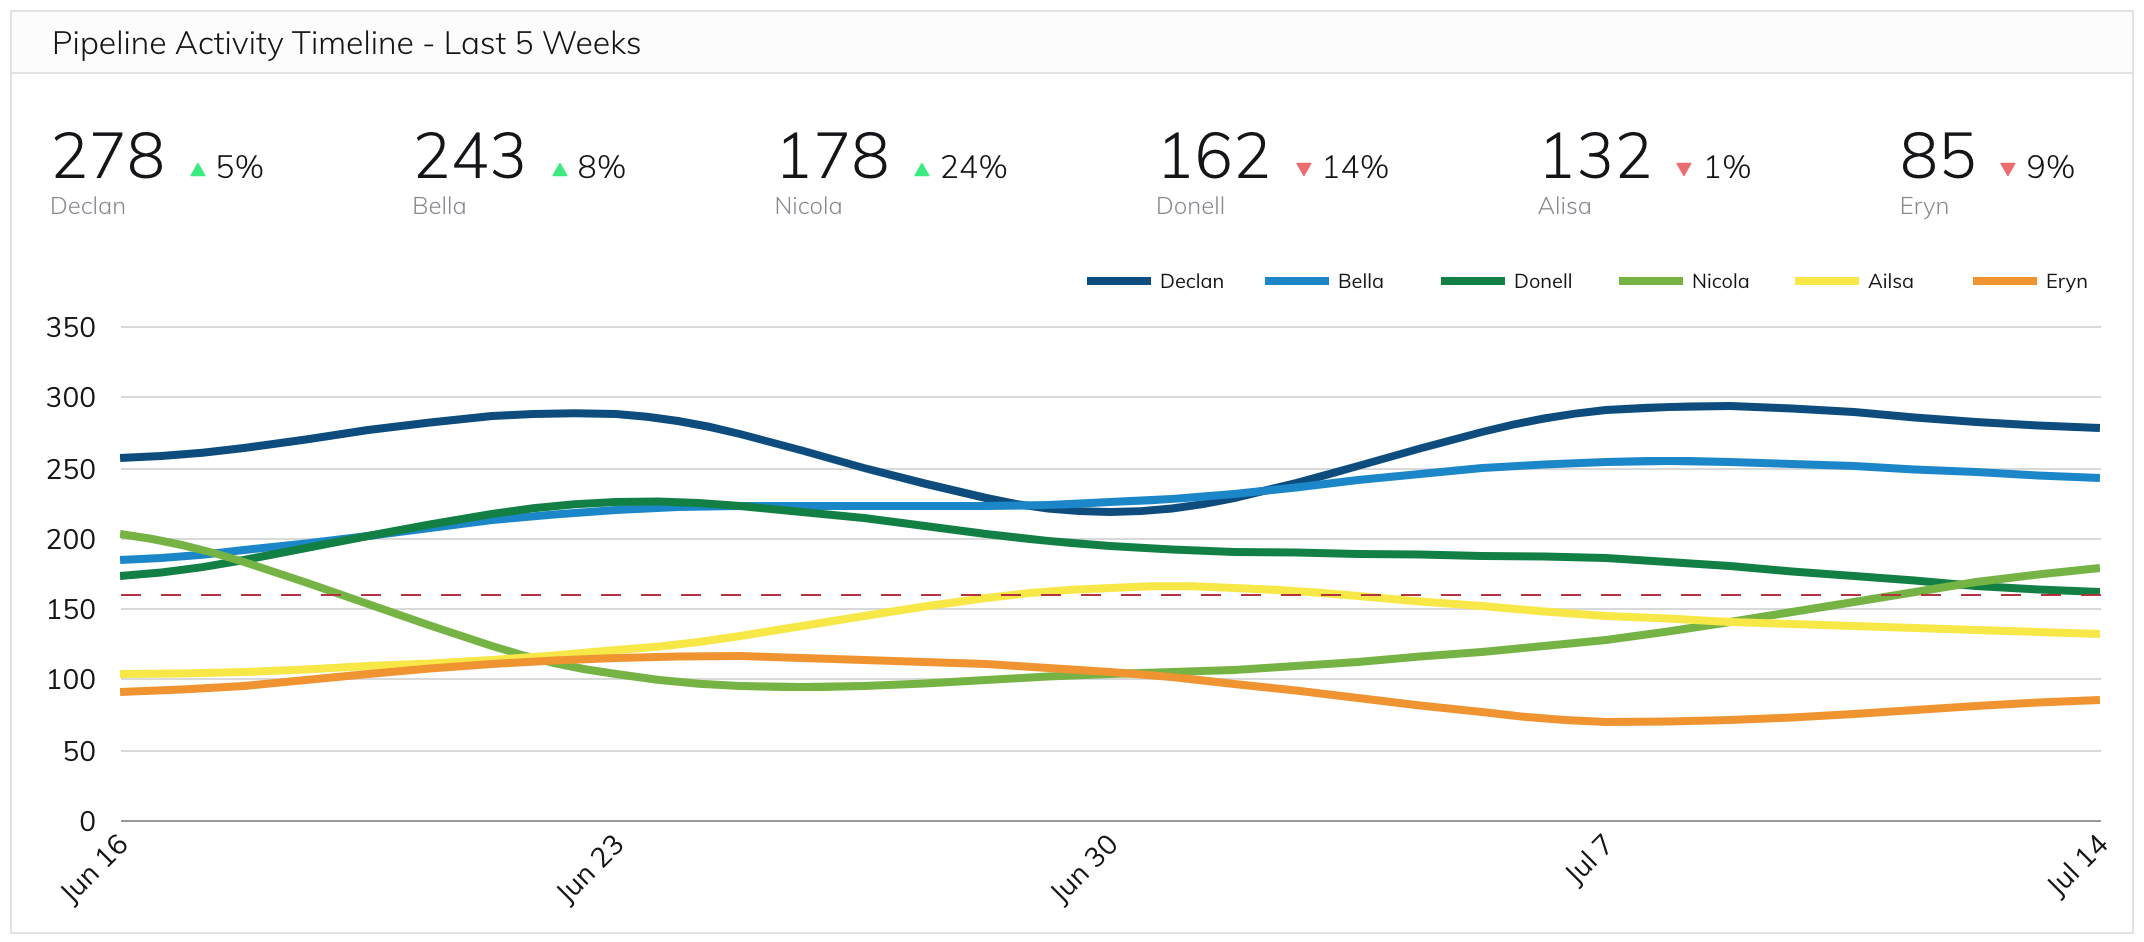
For a single metric that’s relevant every week and a good indicator of productive activity consider measuring Pipeline Activity. This metric measures how productive a salesperson was during the given time period even if no new leads were generated and no deals won. This is accomplished by looking at the changes made to each deal in the sales pipeline during a given time period and assigning a value to this activity.
How to calculate Pipeline Activity
There are several ways to calculate a Pipeline Activity metric with one simple method being to assign a numeric value to each stage in the pipeline which corresponds to the average close ratio at that stage. For example, if the first stage in the pipeline is Lead and the average Lead-to-Close Ratio is 5% then the Lead stage would be assigned a value of 5. If the next stage is Meet and the Meet-to-Close Ratio is 20% then a value of 20 would be assigned to this stage. This process is continued for every stage in the sales funnel until the last stage which represents deals which are won and would be assigned a value of 100.
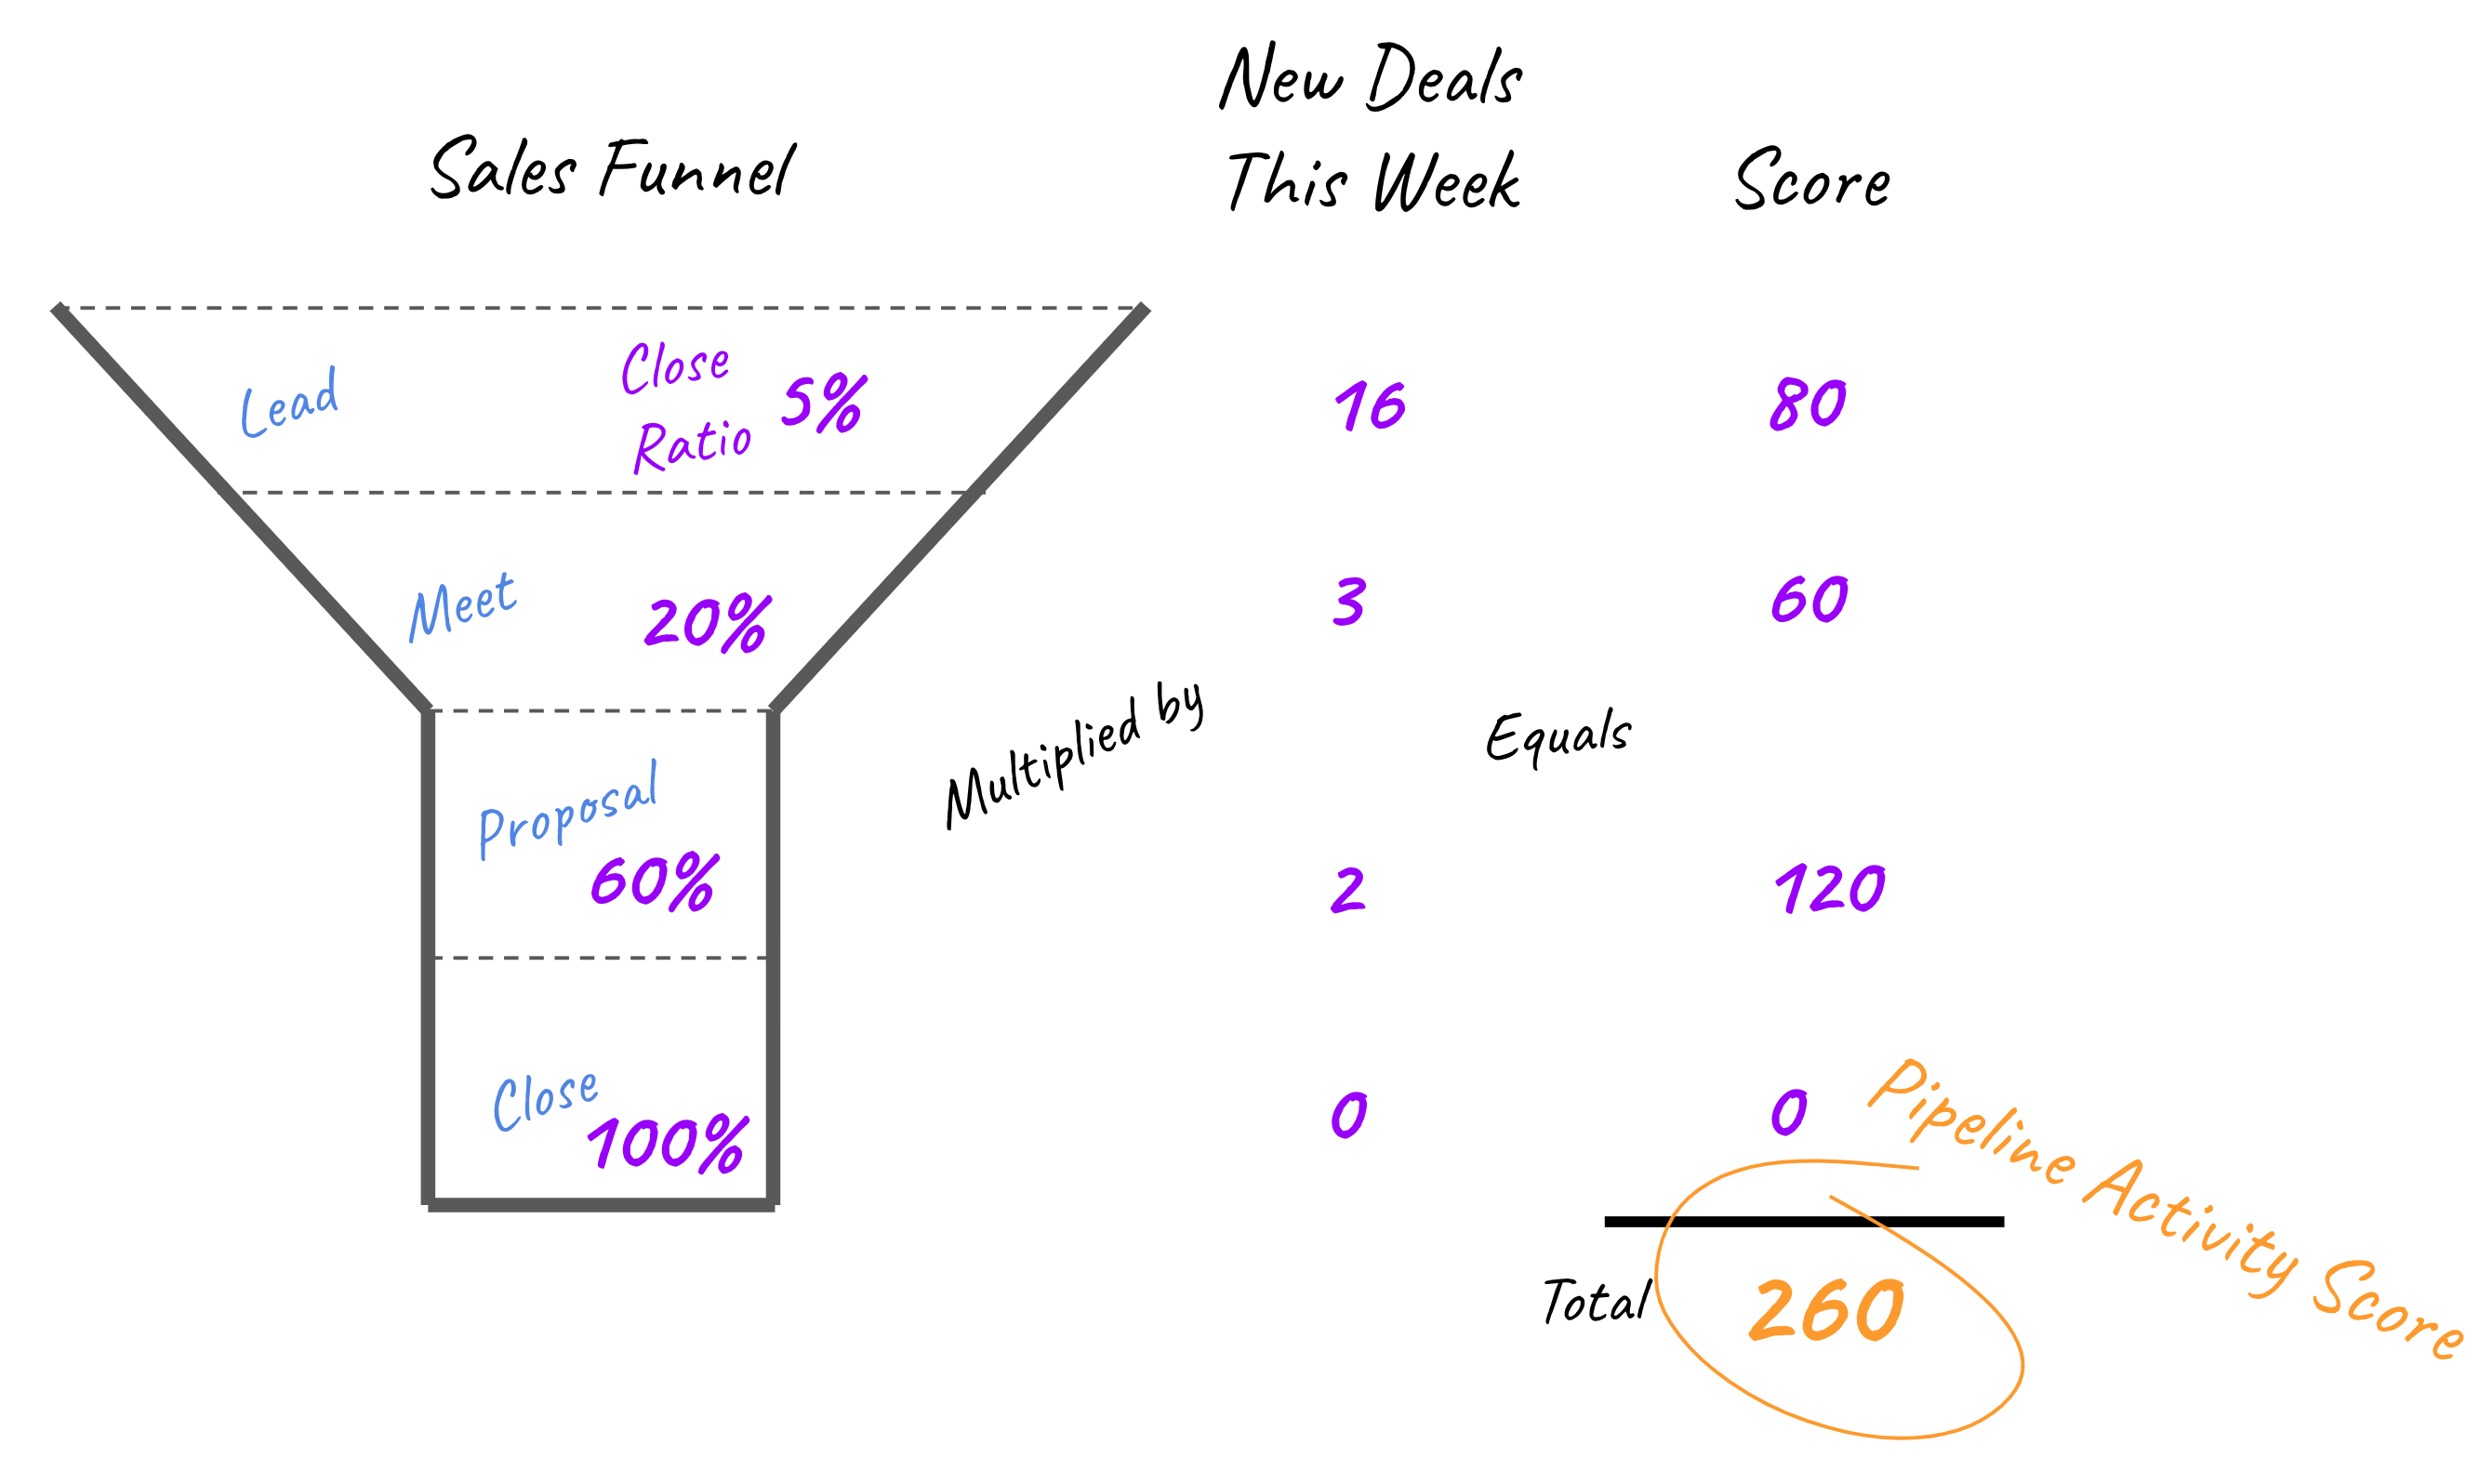
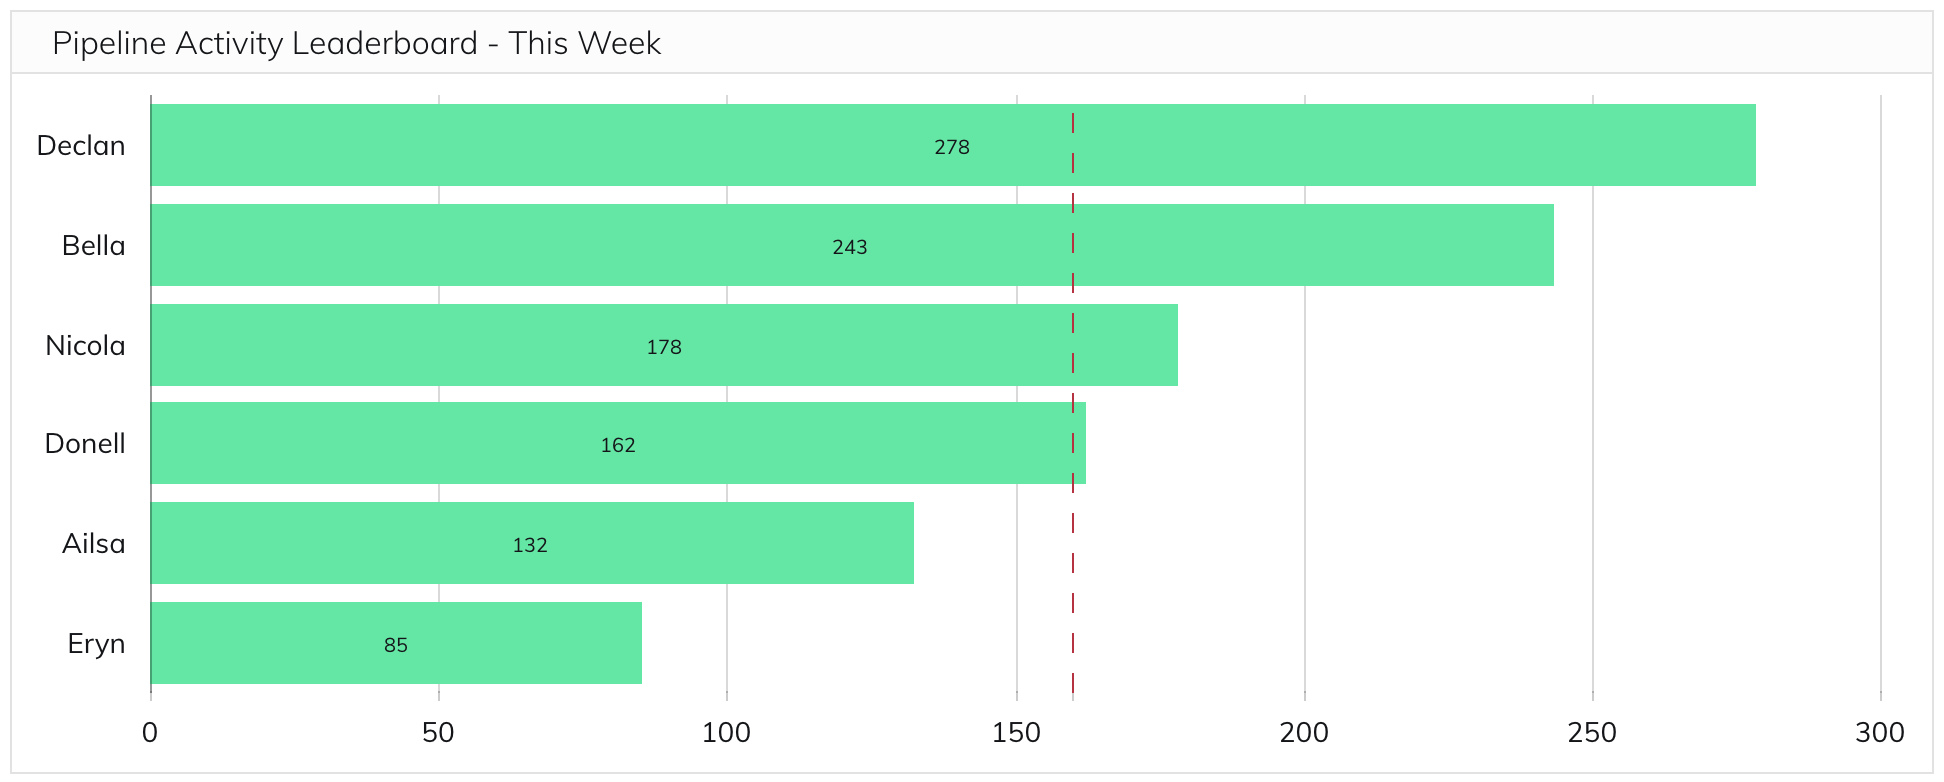
The Pipeline Activity metric is then calculated by taking the number of new deals entering each stage during the time period and multiplying by the value assigned to each stage. The scores are totaled and the resulting metric can then be compared to a previous time period or across salespeople to see it in context.
Because values are assigned to each stage in proportion to the average close rate the activity of adding 20 new deals to the Lead stage is equivalent to moving 5 deals from Lead to Meet both of which are equivalent to closing 1 deal. No matter which activities a salesperson focused on during the week their productivity in moving deals through the pipeline can be ranked and quantified.
Like all metrics, Pipeline Activity isn’t perfect and is best viewed in context with other performance indicators. But for a single metric, it’s possibly the most valuable measure of short term performance.
Bellwether Labs
Providing business intelligence services for ecommerce retailers.
Our team builds decision support systems that reduce ambiguity and empower proactive decision making.
Curious? Don't be shy.
This site is protected by reCAPTCHA and the Google Privacy Policy and Terms of Service apply.
Copyright © 2024 Bellwether Labs.
Copyright © 2024 Bellwether Labs.